Utah Home Prices in 2026: What Can You Buy, and Is There Room to Negotiate?
By Dan Candidi ·
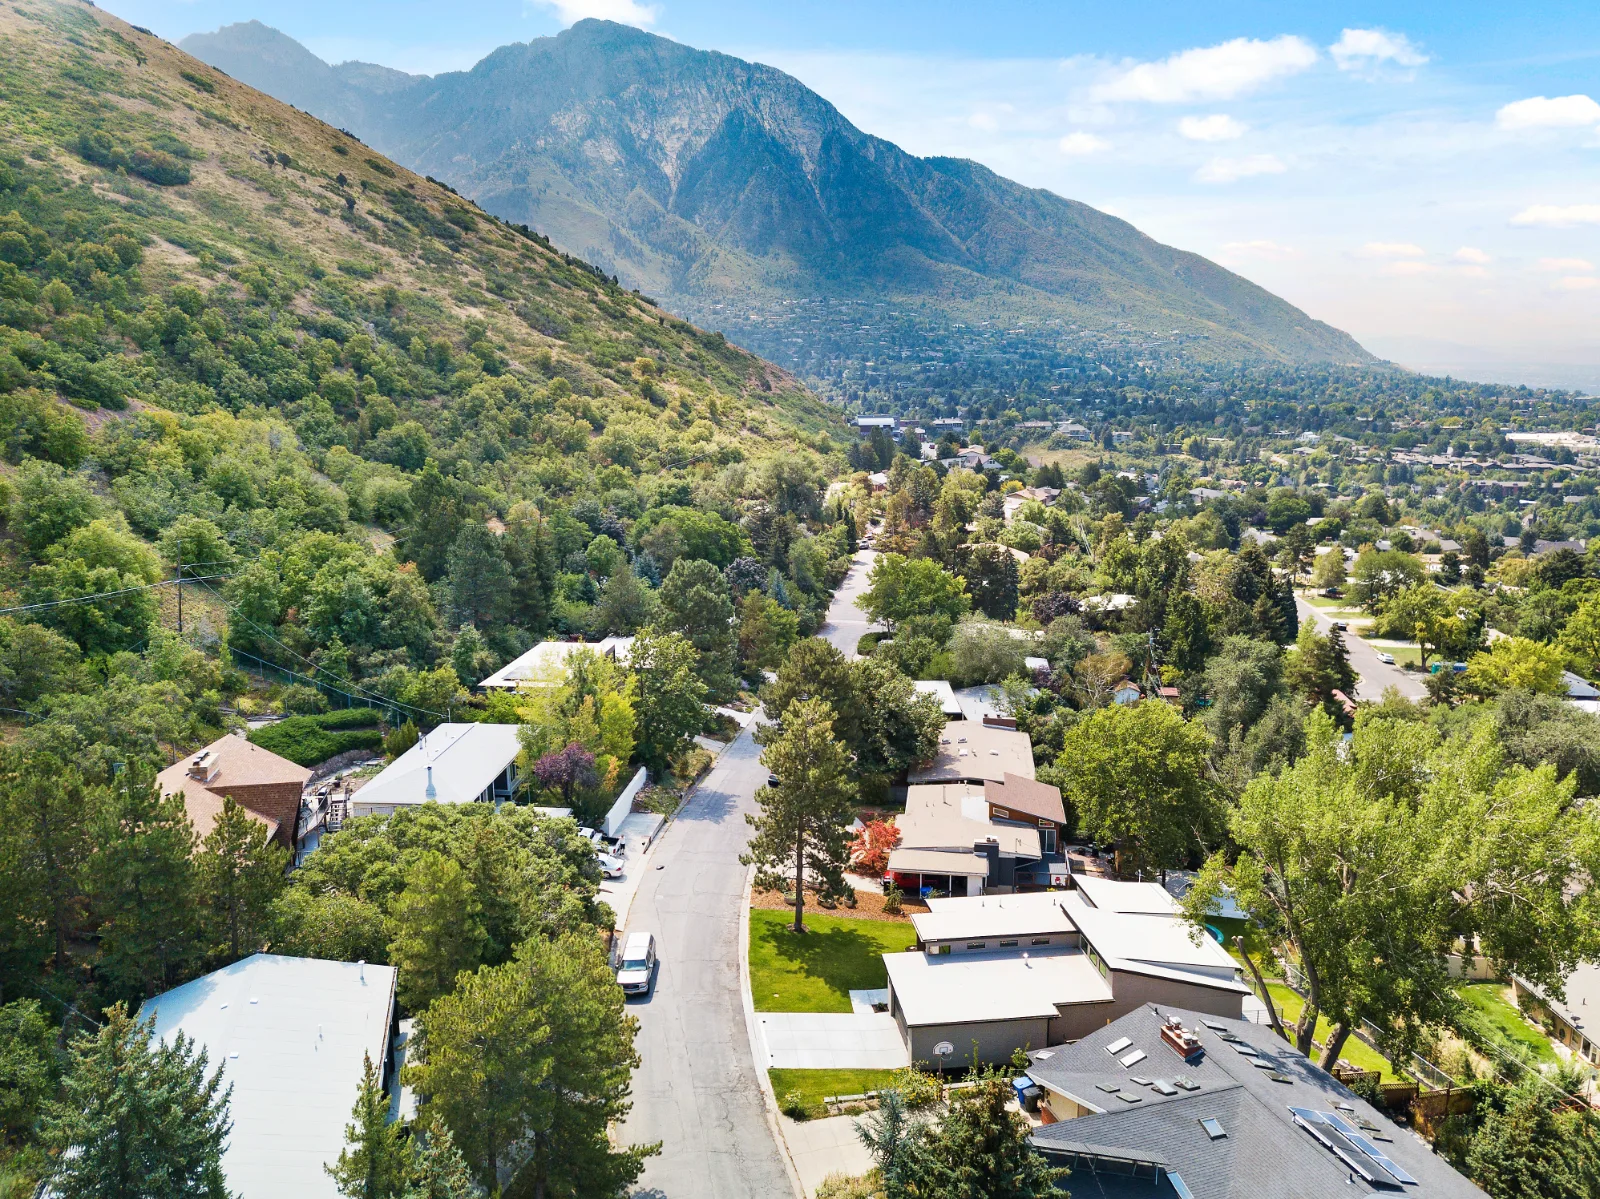
January–September 2026 update for Salt Lake, Utah, Davis, Weber, Wasatch, and Summit counties
By Daniel Candidi
From January through September 2026, single-family median sale prices ranged from $488,510 to $2 million across these six Utah counties. Townhome and condo medians ranged from $350,000 to $1.1 million.
By September, homes took longer to sell than in May. In most markets, buyers also paid a smaller share of the seller’s original asking price. Those changes suggest more room to negotiate after spring.
Mortgage rates went up, too. Apparently, we couldn’t have everything.
How much does a home cost in Utah in 2026?
Here are the median sold prices for January through September. These figures include new construction.
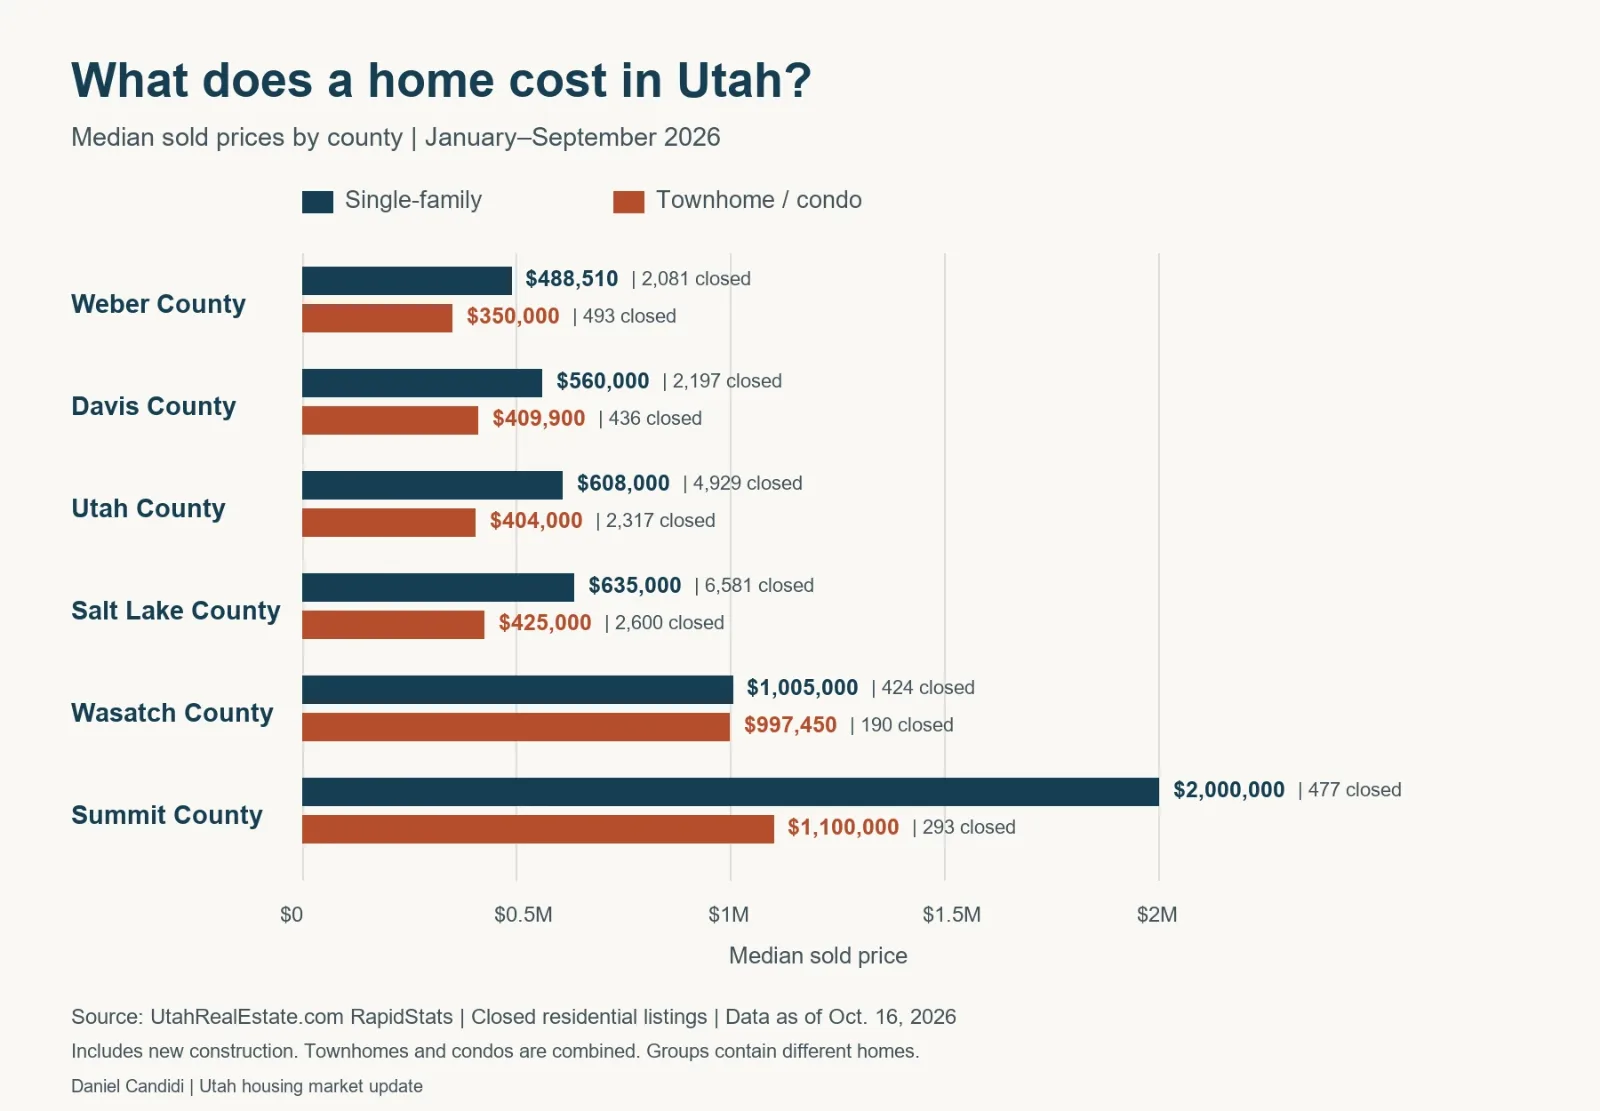
“Median” means the middle sale price. Half sold for less and half sold for more. You can still find homes below these numbers.
Weber had the lowest medians in both groups. In Salt Lake, Utah, and Davis counties, the townhome/condo median was about $150,000 to $210,000 below the single-family median.
That’s a big gap worth exploring if your budget is feeling squeezed.
You’re comparing different groups of homes, though. Size, location, age, and condition all affect price. HOA dues also deserve a place in your budget, even if they don’t get a place on your dream-home Pinterest board.
Are Utah homes taking longer to sell?
Compared with May, yes. RapidStats’ reported median days on market rose from May to September in all six counties for both home types.
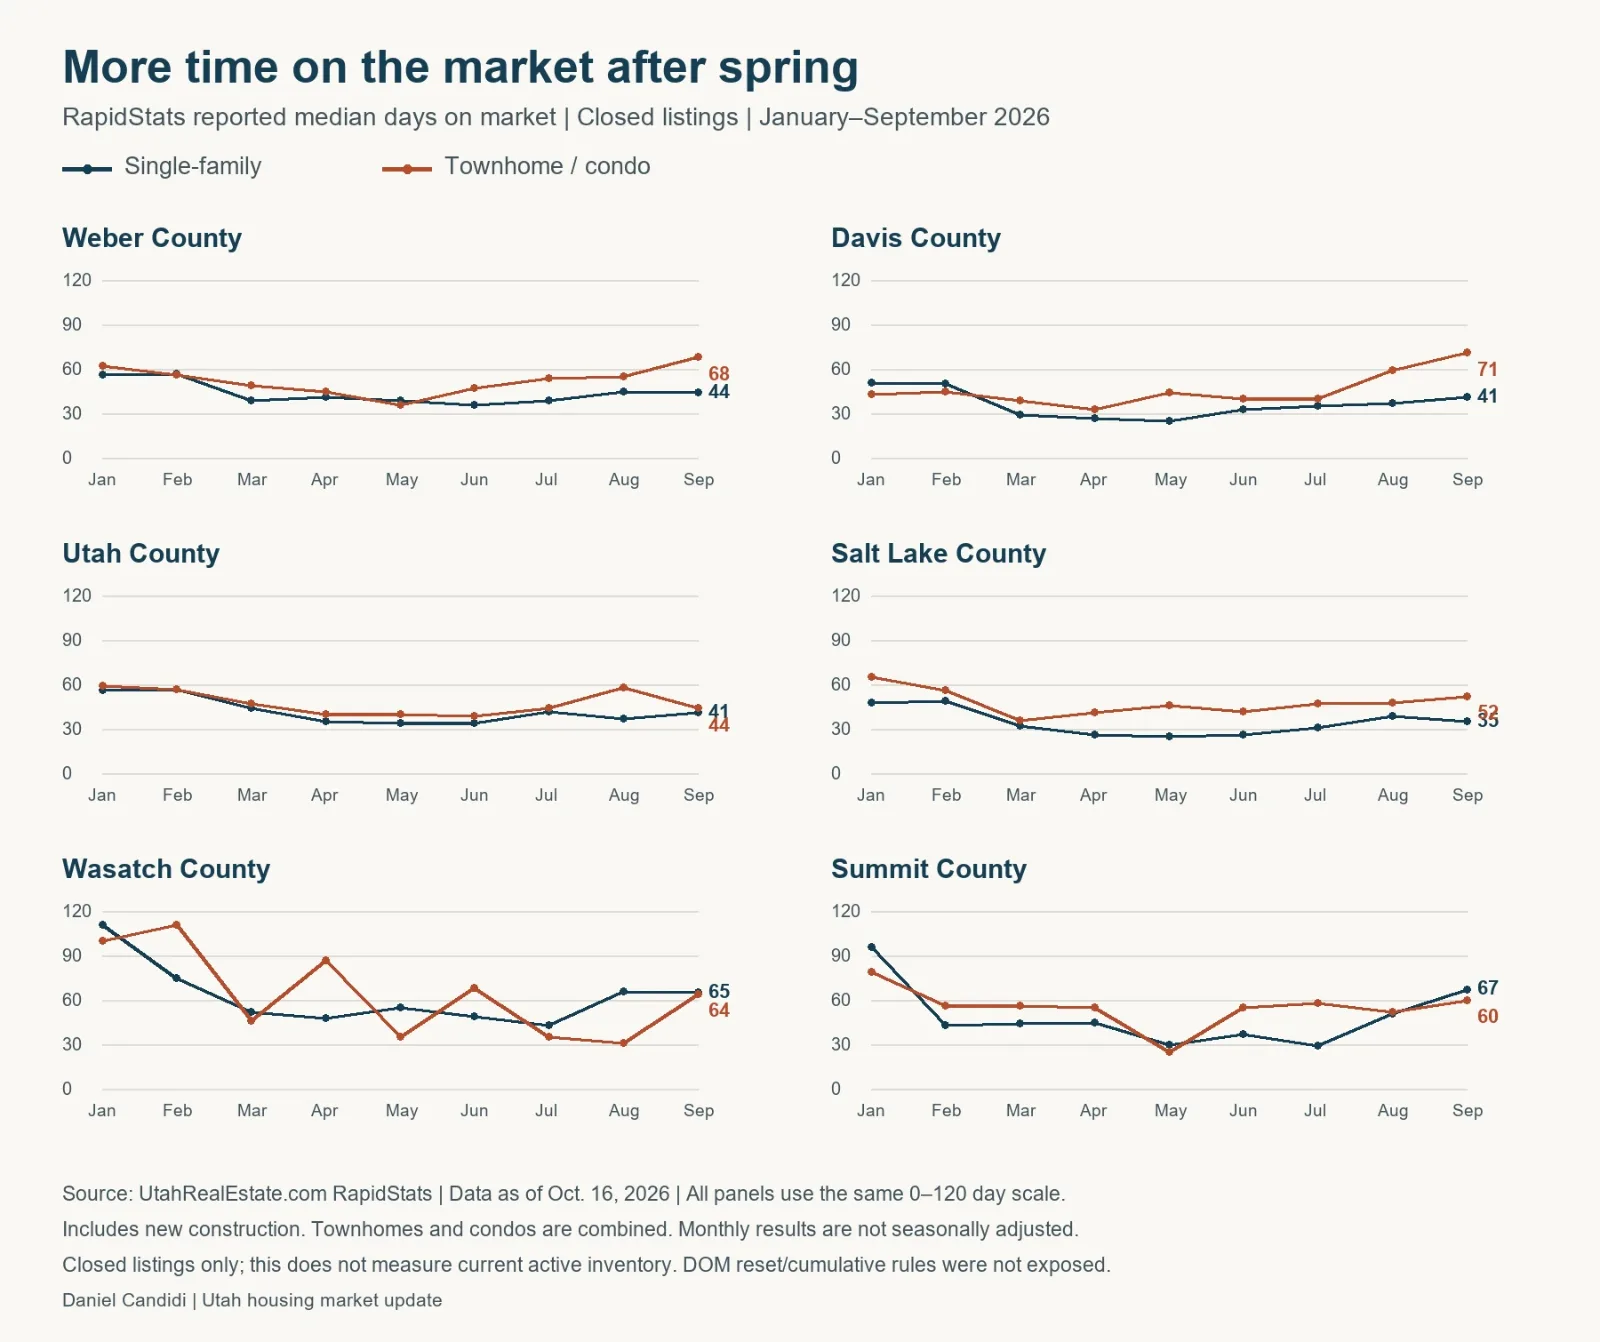
The charts show reported median days on market for closed listings from January–September 2026. Both home categories took longer to sell in September than in May across all six counties, illustrating the article’s discussion of slower sales after spring.
Davis County townhomes and condos went from 44 days in May to 71 in September. Weber’s went from 36 to 68.
But selling times didn’t rise steadily all year. Single-family median DOM was lower in September than in January in every county studied.
Salt Lake County went from 48 days in January to 25 in May, then to 35 in September. Spring moved fast and things slowed afterward. These numbers aren’t seasonally adjusted, so they don’t separate a broader market shift from the usual seasonal cycle.
A listing that has been sitting can be worth a closer look. Maybe the price needs work. Maybe the home needs work. Maybe the photos are doing it absolutely no favors.
Find out why it’s still available before deciding what to offer.
Are Utah buyers paying less than asking price?
In most of these markets, homes sold further below their original asking price in September than in May.
This table shows the median share of the original asking price sellers received:
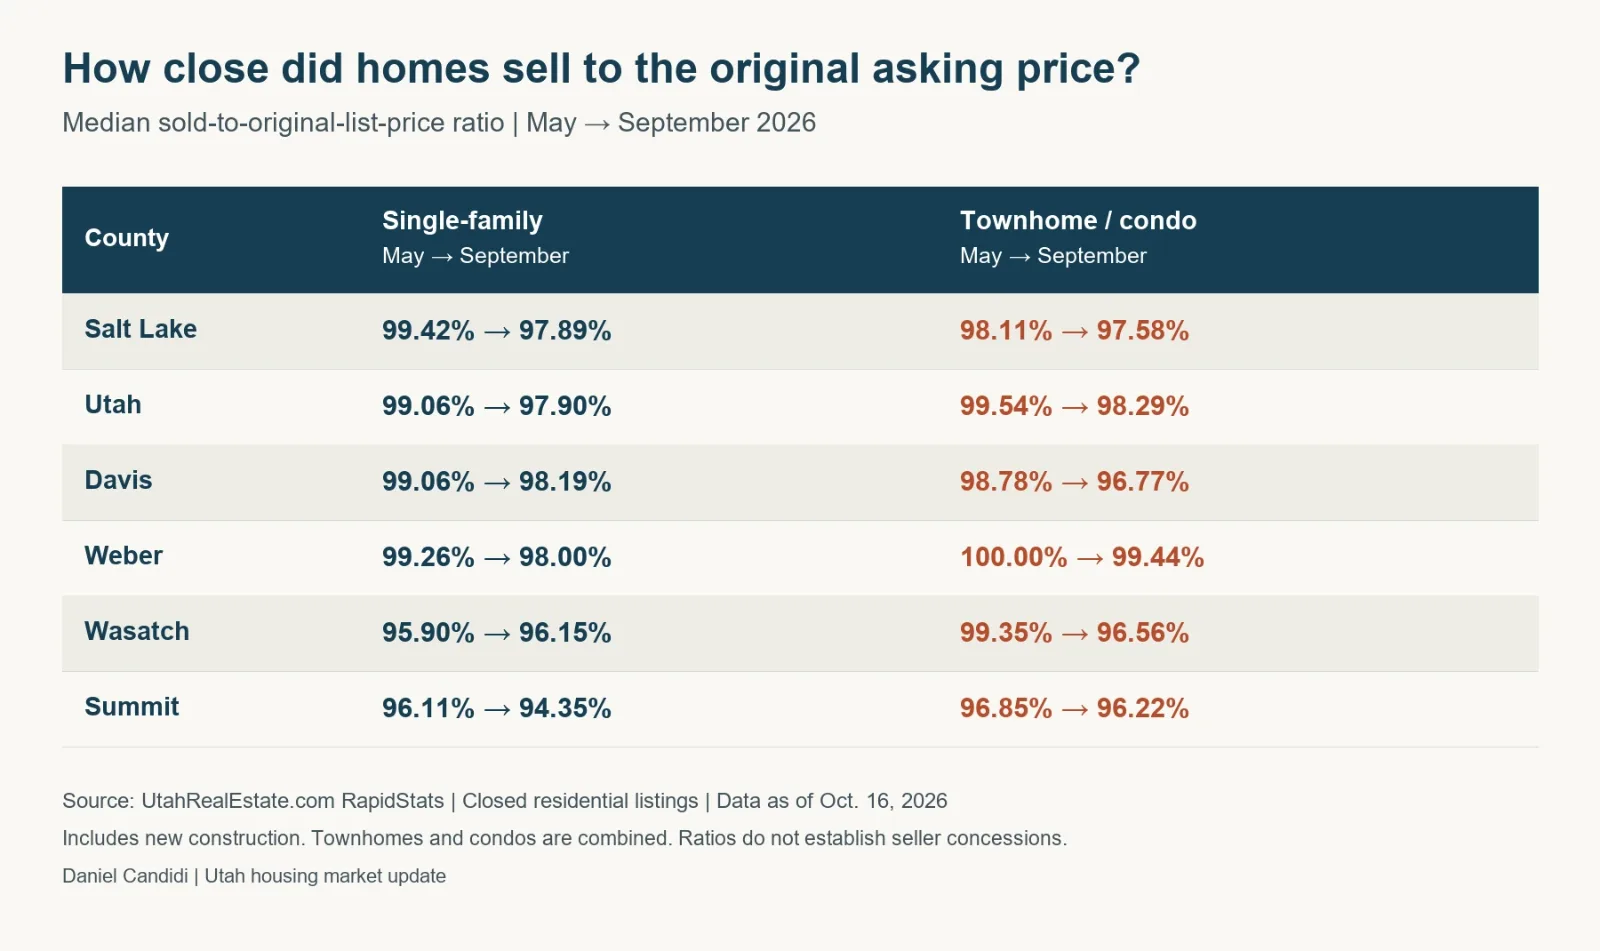
The ratio fell in five of six single-family markets and all six townhome/condo markets. Wasatch single-family homes were the exception.
If the percentages make your eyes glaze over, here’s an example: a home first listed at $500,000 that sells for $490,000 sold for 98% of its original asking price.
I use the original asking price because sellers may cut the price before an offer comes in. This measure captures that whole gap. Seller-paid closing costs and other concessions can change the deal further.
For buyers, this is a reason to study nearby sales and ask good questions. It isn’t a coupon for 2% off every listing.
Did Utah home prices fall during 2026?
It depends on the county and home type. Some September medians were above January’s, while others were below.
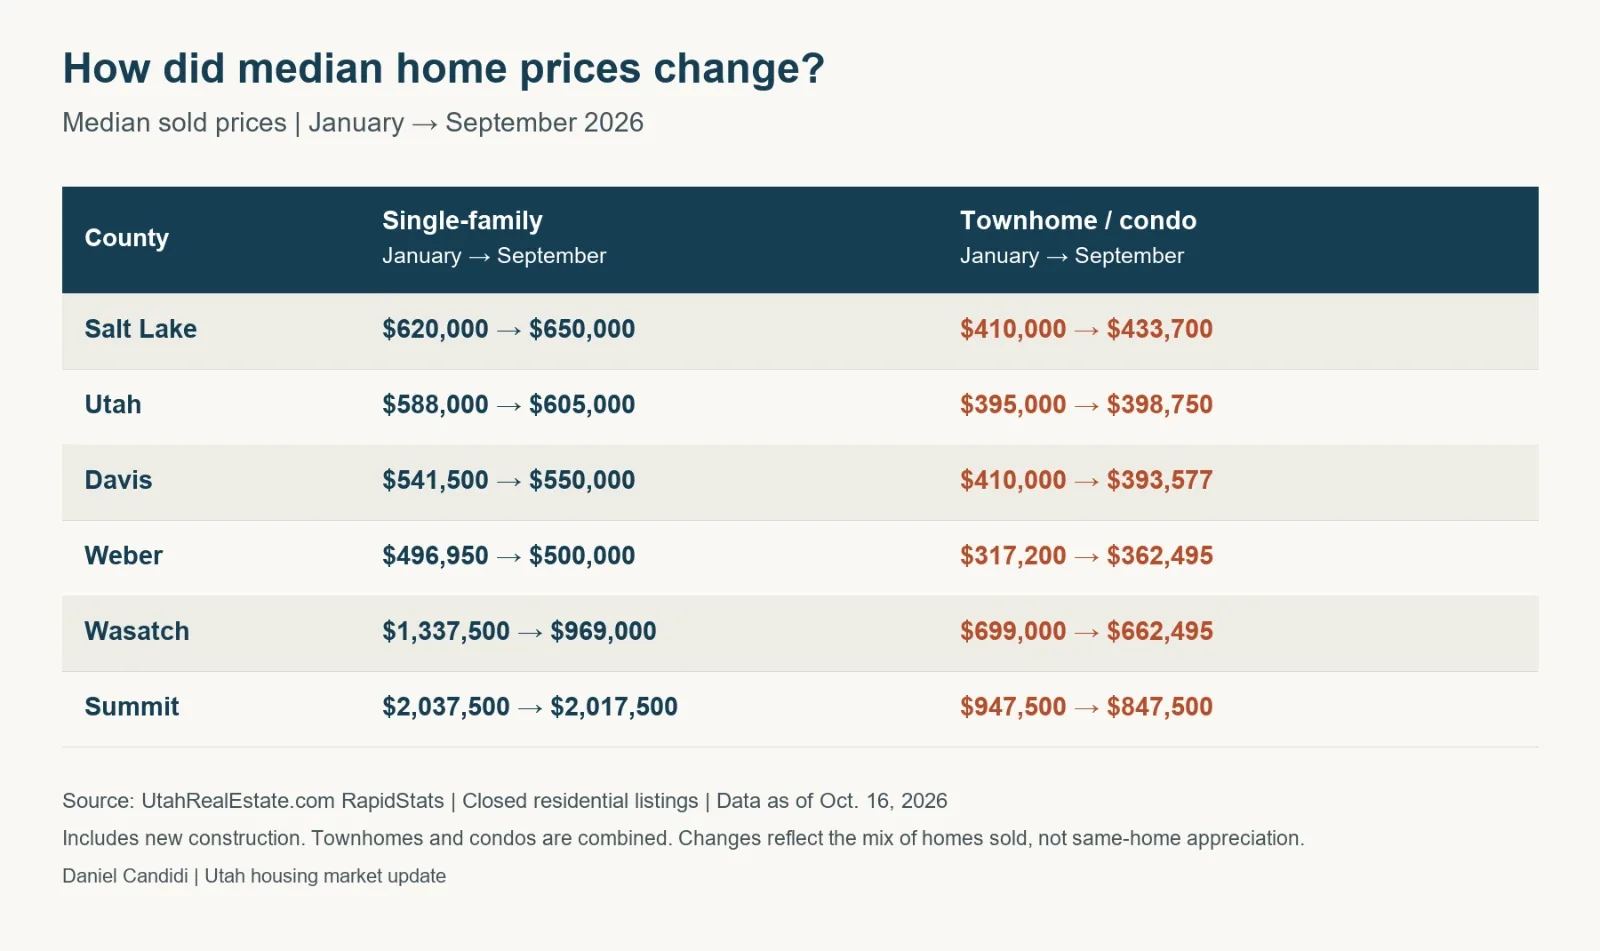
The table shows single-family medians rising in Salt Lake, Utah, Davis and Weber counties and falling in Wasatch and Summit from January to September 2026. Townhome/condo medians fell in Davis, Wasatch and Summit, illustrating the article’s discussion of mixed price changes.
Some markets also backed off their spring or summer highs:
- Davis County’s single-family median reached $575,000 in July and was $550,000 in September.
- Utah County’s reached $626,500 in June and was $605,000 in September.
- Salt Lake County finished September at $650,000, which was $30,000 above January.
Different homes sell each month, and that moves the median. A month with more expensive sales can have a higher median without every homeowner gaining value.
Wasatch and Summit need extra care because their monthly sale counts are smaller. Wasatch’s townhome/condo group had only 10 to 28 closed listings a month during this period.
Before deciding your house gained or lost value, look at recent sales that actually resemble your house.
How did mortgage rates affect buying costs?
Higher rates made the same loan more expensive.
Using Freddie Mac’s weekly national 30-year fixed rates, I calculated averages of about 6.10% for January releases and 6.86% for September releases. These are my averages of the weekly observations. Freddie Mac PMMS archive
Here’s what that means for a $500,000 purchase with 20% down:
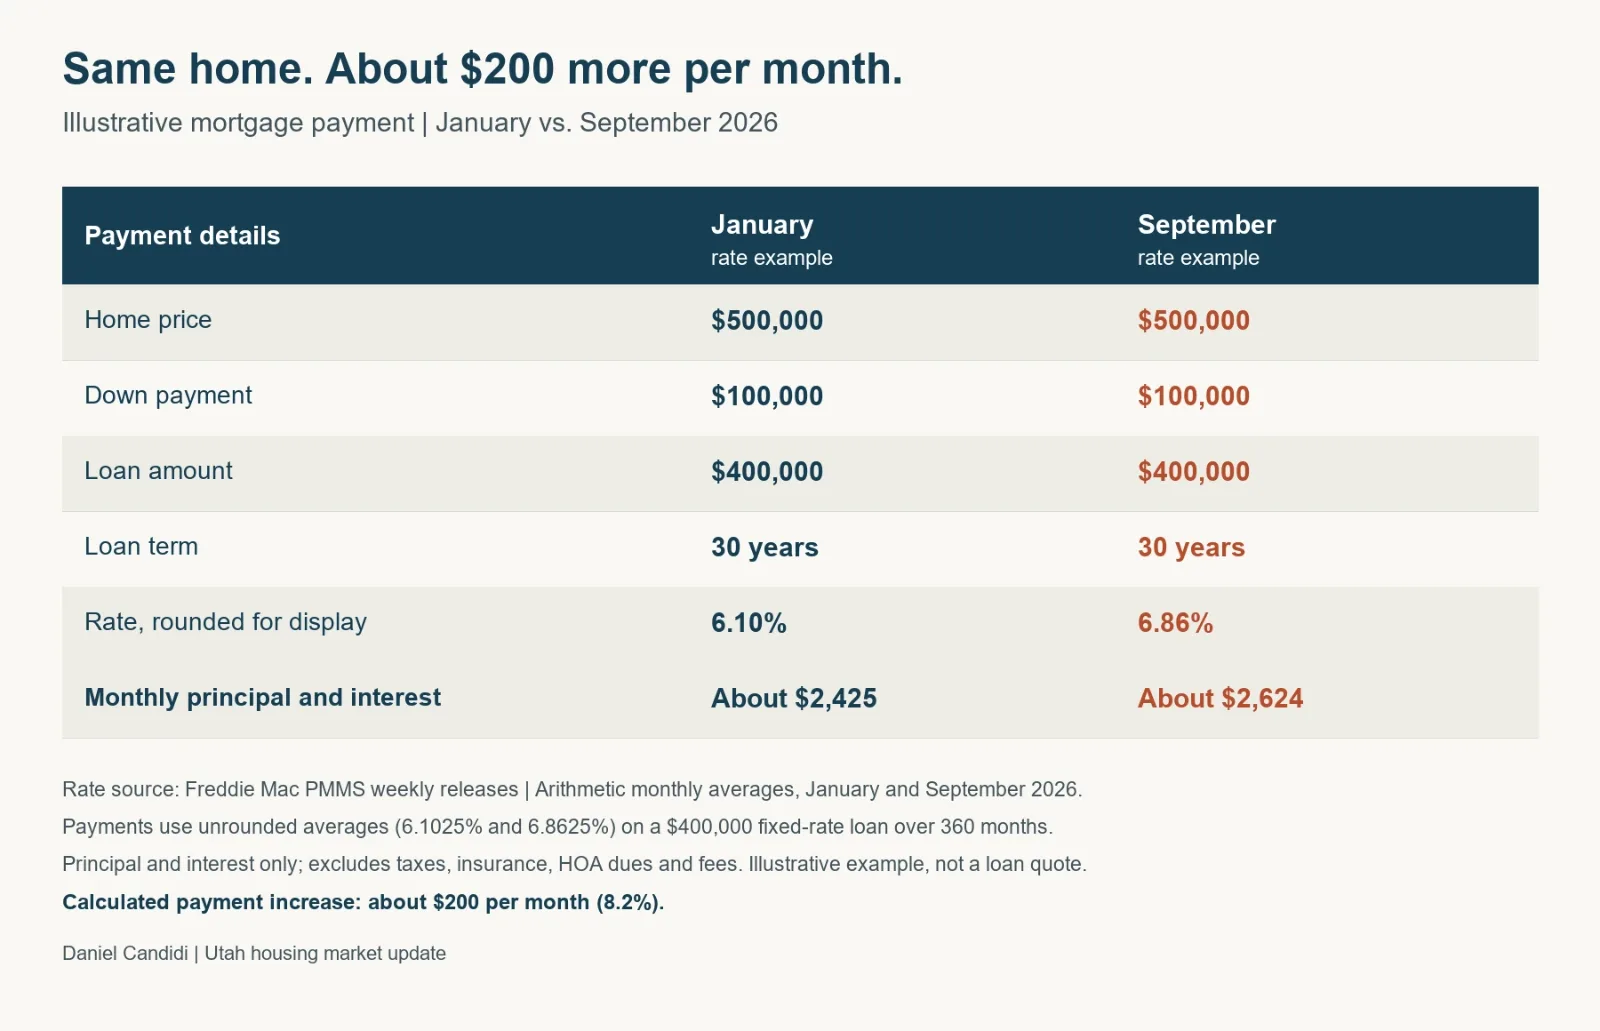
Same price. Same loan. About $200 more a month.
That’s why a price cut can feel good and still leave your payment higher than you expected.
These payments exclude taxes, insurance, HOA dues, and loan costs. The calculations use the unrounded monthly rate averages. Freddie Mac’s survey is a national benchmark focused on conventional conforming purchase loans for buyers with excellent credit and 20% down. Your loan quote may be different. Freddie Mac survey details
My advice: get the payment estimate early. Falling in love with the kitchen before checking the payment is a rough way to spend a Saturday.
What does Utah’s job market tell us?
Utah was still adding jobs in September.
The state reported 25,200 more payroll jobs than a year earlier, a 1.4% increase. The seasonally adjusted unemployment rate was 3.5%. Utah Department of Workforce Services, September 2026 report
That’s useful background. It doesn’t tell us exactly why the housing market slowed after spring.
Rates, the time of year, available homes, and buyers’ budgets can all affect the pace. The housing changes show up in the data without one jobs report needing to explain them all.
What should Utah homebuyers do with this information?
Use the county numbers as a starting point, then compare homes in your neighborhood and price range.
Look at how long a home has been listed, whether its price has changed, and what similar homes nearby sold for. Then decide what matters most in your offer. That might be price, closing costs, repairs, or timing.
If you’re comparing a house with a townhome or condo, compare the full monthly cost. Include HOA dues and ask what they cover.
If you have a house in mind, send it my way. I’ll pull recent comparable sales, starting with the last 90 days, so you can see what similar homes went for. If there aren’t enough close matches, I’ll expand the search.
Call or text 385-483-3764, or email dan@lawsonteam.com.
—Daniel Candidi
Frequently asked questions
Which Utah county has the lowest home prices?
Among the six counties in this report, Weber had the lowest January–September 2026 medians: $488,510 for single-family homes and $350,000 for townhomes and condos combined.
Are Utah townhomes and condos cheaper than single-family homes?
Their combined median sale price was lower in all six counties. Check HOA dues and other ownership costs to see how the monthly payments compare.
Is Utah becoming a buyer’s market?
The data suggests buyers had more negotiating room after spring in many of these markets. Whether a particular home offers that room depends on its price, condition, and competition. A statewide label won’t write your offer for you.
Does selling below asking price mean a home lost value?
No. The seller may have started too high. To judge value, compare the home with similar recent sales.
Should I wait to buy a home in Utah?
Start with what you can comfortably afford today, then compare your choices. Waiting could change prices, rates, and available homes in either direction.
Sources and methodology
Housing figures come from authenticated UtahRealEstate.com RapidStats reports for January 1–September 30, 2026. The site displayed data as of midnight October 16, 2026.
The search covered closed residential listings in Salt Lake, Utah, Davis, Weber, Wasatch, and Summit counties. “Single Family” is the source’s property category, with “Twin” excluded. Townhouse and Condo were combined. New construction was included.
RapidStats calculated the full-period medians separately from the monthly medians. Monthly closed-listing counts add up to the totals in the first table.
Monthly comparisons are not seasonally adjusted. Price medians reflect the mix of homes sold, and DOM describes closed-sale groups rather than current active listings. RapidStats’ exact DOM endpoint and reset method weren’t independently documented, so this report uses its reported DOM figures without assigning a contract or closing-date definition.
RapidStats’ standard reports note that anomalies are removed; the detailed rules weren’t independently documented. MLS data may change with later corrections and does not include every property transfer.
Mortgage rates come from Freddie Mac. I calculated the monthly averages and loan payments for this report. Employment figures come from Utah’s Department of Workforce Services.